• For Individuals
  • For Businesses
  • For Universities
  • For Governments
Coursera
  • Online Degrees
  • Careers
  • Log In
  • Join for Free
    Coursera
    • Browse
    • Chart Js
    Skip to search results

    Filter by

    Subject
    Required
     *

    Language
    Required
     *

    The language used throughout the course, in both instruction and assessments.

    Learning Product
    Required
     *

    Build job-relevant skills in under 2 hours with hands-on tutorials.
    Learn from top instructors with graded assignments, videos, and discussion forums.
    Learn a new tool or skill in an interactive, hands-on environment.
    Get in-depth knowledge of a subject by completing a series of courses and projects.
    Earn career credentials from industry leaders that demonstrate your expertise.

    Level
    Required
     *

    Duration
    Required
     *

    Skills
    Required
     *

    Subtitles
    Required
     *

    Educator
    Required
     *

    Results for "chart.js"

    • Status: Free Trial
      Free Trial
      G

      Google Cloud

      Deploy a Modern Web App connected to a Cloud Spanner Instance

      Skills you'll gain: Cloud Applications, Node.JS, Application Deployment, Google Cloud Platform, Full-Stack Web Development, Web Applications, Server Side, Data Import/Export, Back-End Web Development

      4.3
      Rating, 4.3 out of 5 stars
      ·
      13 reviews

      Beginner · Project · Less Than 2 Hours

    • C

      Coursera Project Network

      RStudio for Six Sigma - Control Charts

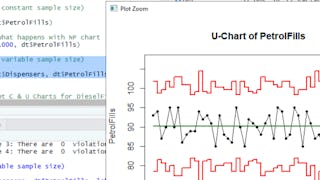
      Skills you'll gain: Statistical Process Controls, Six Sigma Methodology, Quality Control, Plot (Graphics), Data Literacy, Statistical Analysis, R Programming

      Beginner · Guided Project · Less Than 2 Hours

    • Status: Free
      Free
      C

      Coursera Project Network

      Utiliser LucidChart pour petites entreprises

      Skills you'll gain: Process Flow Diagrams, User Accounts, Organizational Structure, Recruitment, Data Visualization, Business Process Modeling

      Beginner · Guided Project · Less Than 2 Hours

    • Status: Free Trial
      Free Trial
      U

      University of California, Davis

      Data Manipulation in JavaScript

      Skills you'll gain: Ajax, Javascript and jQuery, Data Validation, JSON, Javascript, Event-Driven Programming, Web Development Tools, Application Programming Interface (API), Object Oriented Programming (OOP), Maintainability, Debugging

      4.8
      Rating, 4.8 out of 5 stars
      ·
      68 reviews

      Beginner · Course · 1 - 4 Weeks

    • U

      University of Illinois Urbana-Champaign

      3D Data Visualization for Science Communication

      Skills you'll gain: Data Literacy, Data Storytelling, Scientific Visualization, Visualization (Computer Graphics), Data Presentation, Data Visualization Software, Spatial Data Analysis, Computer Graphics, 3D Modeling, Video Production

      Beginner · Course · 1 - 3 Months

    • B

      Ball State University

      Data Visualization

      Skills you'll gain: Rmarkdown, Exploratory Data Analysis, Data Visualization Software, Ggplot2, Interactive Data Visualization, Statistical Visualization, Visualization (Computer Graphics), R Programming, Data Storytelling, Data Presentation, Histogram, Scatter Plots, Data Analysis, Data Manipulation

      Build toward a degree

      Intermediate · Course · 1 - 3 Months

    • G

      Google Cloud

      Use Data Canvas to Visualize and Design Queries

      Skills you'll gain: Data Presentation, Data Visualization Software, Query Languages, Data Integration, Data Analysis

      Beginner · Project · Less Than 2 Hours

    • G

      Google Cloud

      Visualizing Billing Data with Google Data Studio

      Skills you'll gain: Google Cloud Platform, Data Presentation, Data Visualization Software, Data Import/Export, Big Data, Analytics

      Beginner · Project · Less Than 2 Hours

    • Status: New
      New
      Status: Free Trial
      Free Trial
      U

      University of Colorado Boulder

      BiteSize Python: Data Visualization

      Skills you'll gain: Matplotlib, Plotly, Seaborn, Data Visualization Software, Statistical Visualization, Interactive Data Visualization, Scatter Plots, Box Plots, Heat Maps, Histogram

      Intermediate · Course · 1 - 3 Months

    • C

      Coursera Project Network

      Plots Creation using Matplotlib Python

      Skills you'll gain: Matplotlib, Box Plots, Plot (Graphics), Seaborn, Data Visualization Software, Pandas (Python Package), Scatter Plots, Data Presentation, Data Import/Export, Histogram, Python Programming, Data Manipulation, Data Structures

      3.9
      Rating, 3.9 out of 5 stars
      ·
      9 reviews

      Beginner · Guided Project · Less Than 2 Hours

    • C

      Coursera Project Network

      Interactive Statistical Data Visualization 101

      Skills you'll gain: Plotly, Plot (Graphics), Statistical Visualization, Box Plots, Scatter Plots, Interactive Data Visualization, Data Visualization Software, Histogram

      4.9
      Rating, 4.9 out of 5 stars
      ·
      7 reviews

      Beginner · Guided Project · Less Than 2 Hours

    • Status: New
      New
      Status: Free Trial
      Free Trial
      J

      Johns Hopkins University

      Advanced Techniques in Data Visualization

      Skills you'll gain: Data Visualization Software, Interactive Data Visualization, Geospatial Information and Technology, Color Theory, Tree Maps, Data Storytelling, Heat Maps, Data Mapping, Text Mining, Unstructured Data, Network Analysis

      Intermediate · Course · 1 - 3 Months

    Searches related to chart.js

    pivot tables and charts
    use charts in google sheets
    building candlestick charts with google sheets
    presenting data using charts with canva
    create charts and dashboards using microsoft excel
    create charts and dashboard using google sheets
    conditional formatting, tables and charts in microsoft excel
    rstudio for six sigma - control charts
    1…6789

    In summary, here are 10 of our most popular chart.js courses

    • Deploy a Modern Web App connected to a Cloud Spanner Instance: Google Cloud
    • RStudio for Six Sigma - Control Charts: Coursera Project Network
    • Utiliser LucidChart pour petites entreprises: Coursera Project Network
    • Data Manipulation in JavaScript: University of California, Davis
    • 3D Data Visualization for Science Communication: University of Illinois Urbana-Champaign
    • Data Visualization: Ball State University
    • Use Data Canvas to Visualize and Design Queries: Google Cloud
    • Visualizing Billing Data with Google Data Studio: Google Cloud
    • BiteSize Python: Data Visualization: University of Colorado Boulder
    • Plots Creation using Matplotlib Python: Coursera Project Network

    Other topics to explore

    Arts and Humanities
    338 courses
    Business
    1095 courses
    Computer Science
    668 courses
    Data Science
    425 courses
    Information Technology
    145 courses
    Health
    471 courses
    Math and Logic
    70 courses
    Personal Development
    137 courses
    Physical Science and Engineering
    413 courses
    Social Sciences
    401 courses
    Language Learning
    150 courses

    Coursera Footer

    Technical Skills

    • ChatGPT
    • Coding
    • Computer Science
    • Cybersecurity
    • DevOps
    • Ethical Hacking
    • Generative AI
    • Java Programming
    • Python
    • Web Development

    Analytical Skills

    • Artificial Intelligence
    • Big Data
    • Business Analysis
    • Data Analytics
    • Data Science
    • Financial Modeling
    • Machine Learning
    • Microsoft Excel
    • Microsoft Power BI
    • SQL

    Business Skills

    • Accounting
    • Digital Marketing
    • E-commerce
    • Finance
    • Google
    • Graphic Design
    • IBM
    • Marketing
    • Project Management
    • Social Media Marketing

    Career Resources

    • Essential IT Certifications
    • High-Income Skills to Learn
    • How to Get a PMP Certification
    • How to Learn Artificial Intelligence
    • Popular Cybersecurity Certifications
    • Popular Data Analytics Certifications
    • What Does a Data Analyst Do?
    • Career Development Resources
    • Career Aptitude Test
    • Share your Coursera Learning Story

    Coursera

    • About
    • What We Offer
    • Leadership
    • Careers
    • Catalog
    • Coursera Plus
    • Professional Certificates
    • MasterTrack® Certificates
    • Degrees
    • For Enterprise
    • For Government
    • For Campus
    • Become a Partner
    • Social Impact
    • Free Courses
    • ECTS Credit Recommendations

    Community

    • Learners
    • Partners
    • Beta Testers
    • Blog
    • The Coursera Podcast
    • Tech Blog
    • Teaching Center

    More

    • Press
    • Investors
    • Terms
    • Privacy
    • Help
    • Accessibility
    • Contact
    • Articles
    • Directory
    • Affiliates
    • Modern Slavery Statement
    • Manage Cookie Preferences
    Learn Anywhere
    Download on the App Store
    Get it on Google Play
    Logo of Certified B Corporation
    © 2025 Coursera Inc. All rights reserved.
    • Coursera Facebook
    • Coursera Linkedin
    • Coursera Twitter
    • Coursera YouTube
    • Coursera Instagram
    • Coursera TikTok